Equal error rate and biometric systems
Posted on Fri 05 May 2023 in metrics Updated: Fri 05 May 2023 • 4 min read
Biometrics systems are focused on obtaining the characteristics of an individual and verifying if it does match with someone in the database. These characteristics can be the fingerprint, the voice, and even our iris. These kinds of systems are everywhere nowadays, in our phones and even door locks, therefore some safety countermeasures must be taken to provide safety to the users. We don't want to have a strange breaking into our house or having access to our bank account due to an authentication error.
How are biometric systems evaluated?
The equal error rate is widely used to evaluate systems that require certain levels of security, such as biometric systems. This metric also measures how usable certain application is, since with a very strict biometric system, a lot of true positives (someone who is in fact authenticated) can be rejected. On the other hand with a loose system, a lot of negatives (impostors) can be authenticated. So this is what the error rate is about, finding the balance between these two cases.
To understand the Equal Error Rate, we should first recover a few topics from binary systems evaluation. The ones I'll cover are:
- Traditional classification metrics
- ROC curve & AUC
- Equal error rate (finally)
Classification metrics
More specifically, on this topic, we will cover binary classification metrics that are commonly used to evaluate models trained on this specific task.
Given the following confusion matrix:
| TRUE-GT | FALSE-GT | |
| PREDICTED TRUE | 12 (TP) | 4 (FN) |
| PREDICTED FALSE | 1 (FP) | 15 (TN) |
Precision:
The precision is calculated given the following statement:
How many of the samples that were positive (12+1 - the whole TRUE-GT column) were actually predicted as so (12 - predicted true row)?
Precision = TP / TP + FP
In this case, our precision would be 12/13 = 0.9230 or 92.30%;
Recall (Specificity):
The specificity or recall is measured according to the following question: How many were tagged as positive and actually pertain to the positive class?
Recall = TP / TP+FN
In this case, our recall would be 12/ 12+4 = 0.75 or 75%
Accuracy:
Explained in short: How many samples have we predicted right?
accuracy = TP + TN / FP + FN + TP + FN
Our accuracy value would be equal to: 12 + 15 / 12 + 15 + 4 + 1 = 0.8437 or 84.37%
ROC (Receiver Operating Characteristics)
Why do we need it? Usually, our precision and recall are in tension, so whenever we increase the precision, very often the recall decreases and vice-versa.
So let's say our system is a binary classifier that returns the probability (1 being our positive class and 0 the negative one)
The ROC curve evaluates the model performance on different thresholds that separate the classes. Using the 0.5 threshold may not be the best option, so that's why it's important to plot the ROC curve.
Let's say you trained a face verification system and you want to predict whether the owner of the phone it's trying to unlock it or not. We use 5 samples to test this model and rank them by the probability of being the positive class (1).
| PROBABILITY | |
| OWNER | 0.9 |
| OWNER | 0.7 |
| FRAUD 1 | 0.5 |
| FRAUD 2 | 0.4 |
| FRAUD 3 | 0.3 |
If we start with the THRESHOLD = 0.5, we would have accepted the first three rows as positives (we would unlock the phone) and we would reject the 2 other ones.
Our confusion matrix would look like this:
| TRUE-GT | FALSE-GT | |
| PREDICTED TRUE | 2 (TP) | 1 (FN) |
| PREDICTED FALSE | 0 (FP) | 2 (TN) |
The ROC curve is plotted using a bunch of different threshold and measuring how well the system performs on that. So for our 0.5 case, we would calculate the TPR (True positive rate) and FPR (False positive rate).
True positive rate (It's the same as recall) = TP / TP + FN = 2 / 2 + 1 = 0.67
False positive rate (Same as specificity) = 0 / 0 + 2 = 0.
So we would test different threshold values and add points to our plot accordingly. This is what a regular ROC curve looks like:

The diagonal line represents a random chance model, so every model that's below that line is literally performing worse than dice.
Something cool to mention is that the greater the area under this curve, the better the model is. So if you want to compare two models using this criterion, plot their ROC curves and analyze the areas under them. This is called the AREA UNDER CURVE (AUC) metric.
Equal Error Rate (Finally)
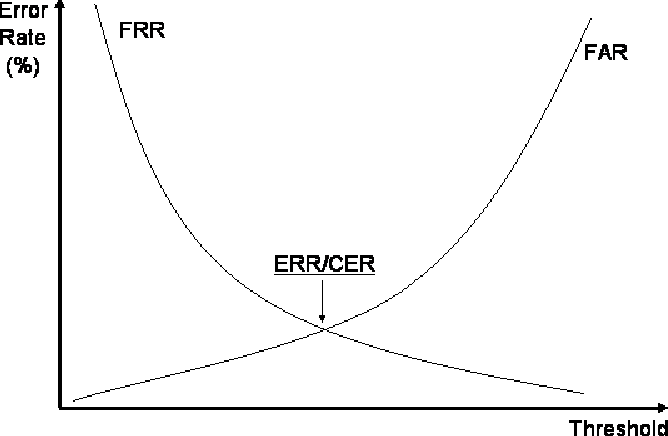
When calculating the equal error rate, we want to find the balance between the FALSE ACCEPTANCE RATE - which is the acceptance of impostors in our system, and the FALSE REJECTION RATE - which refers to not allowing someone who should be in fact authenticated.
The false acceptance rate (FAR) is calculated by:
False positive / True positive + False negative
The false rejection rate (FRR) is calculated by:
False negative / False negative + True Negative
To calculate the equal error rate we should vary the classification threshold just as in the ROC curve example mentioned above. Then calculate the different values of FRR and FAR and identify where the curves match. The lower the EER the better the system.

References:
https://www.innovatrics.com/glossary/equal-error-rate-eer/
https://recfaces.com/articles/false-rejection-rate
https://wentzwu.com/2019/05/05/which-is-more-important-accuracy-or-acceptability/